Parameter optimization
To start parameter optimization, click on Tools->Optimization, or use the keyboard shortcut Ctrl+P.
The parameter optimization interface displays a history of the best set of parameters and their fitness, along with images of the optimization targets (species concentrations or concentration rate of changes) compared with the resulting values from the current best set of parameters.
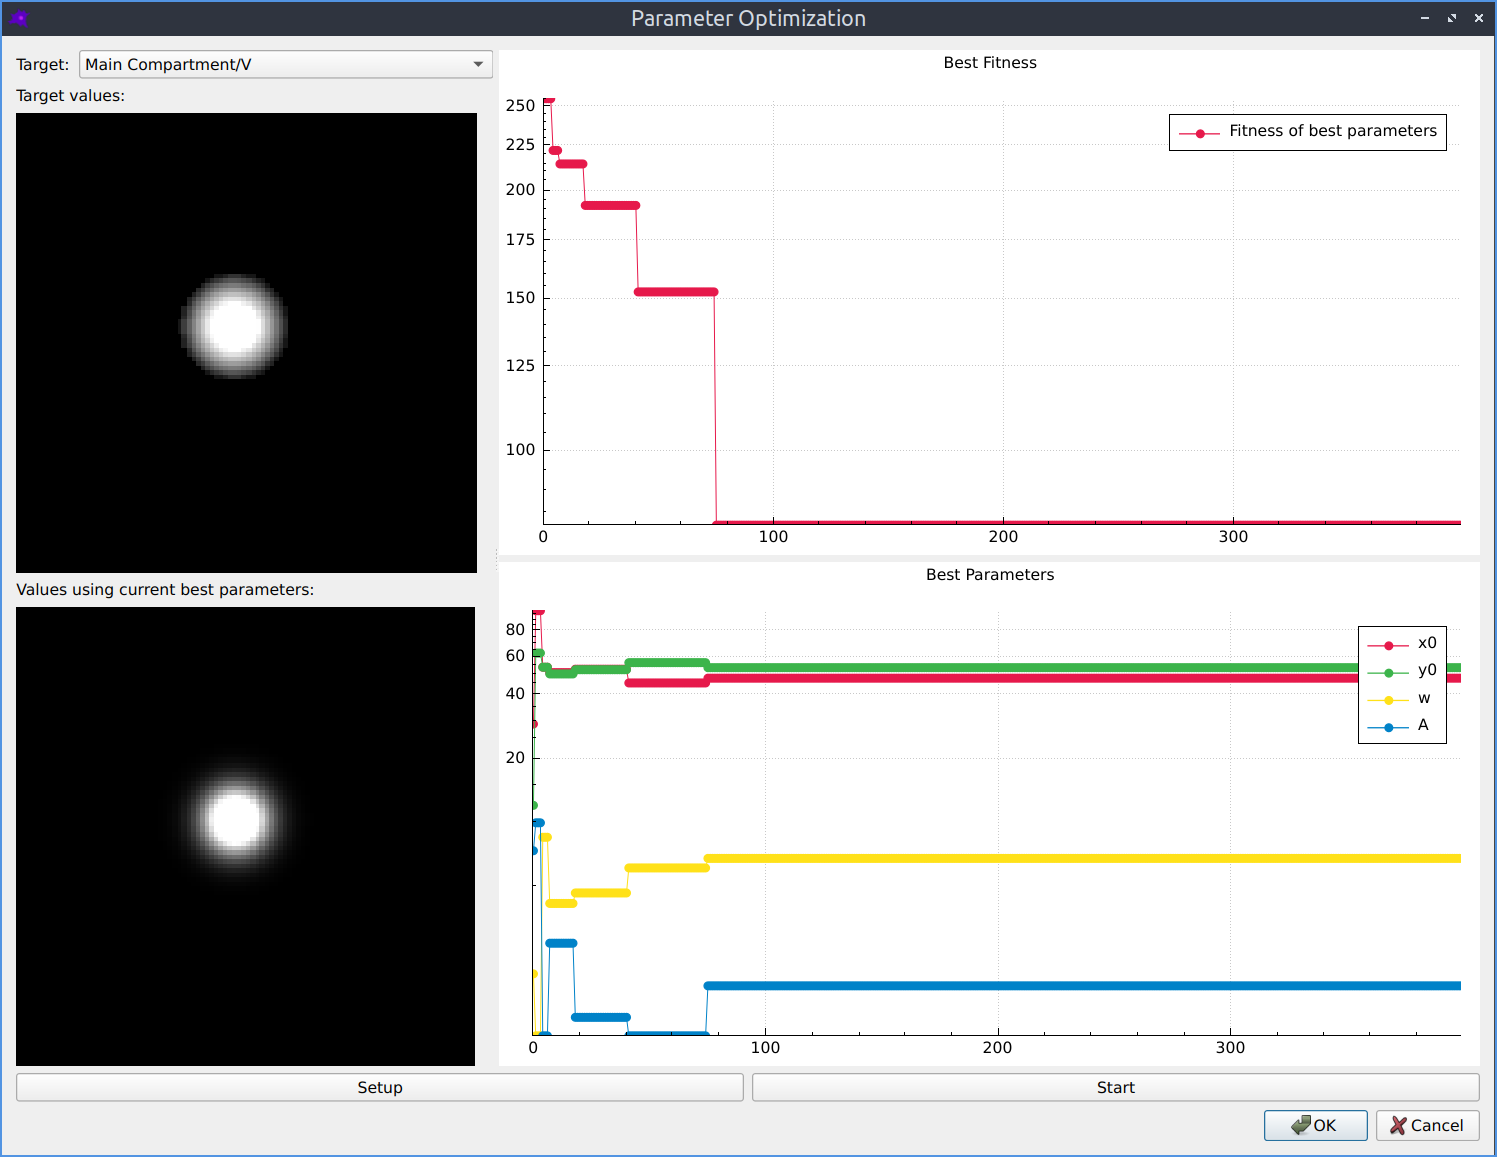
The parameter optimization interface.
- Targets and results (left side)
If you have multiple targets, you can choose which one to display from the dropdown list
The upper image shows the target concentration (or concentration rate of change) values
The lower image shows the actual values from the simulation using the current best set of parameters
- Fitness and parameters (right side)
The upper plot shows the history of fitness values during the optimization (lower is better)
The lower plot shows the history of the best set of parameters for at each optimization iteration
- Setup
Click the Setup button to change the optimization settings
See the Optimization Setup section for more details
- Start
Click the Start button to start optimizing
You can stop and continue optimization
When you are happy with your parameters you can press Stop and then OK. You will then be asked if you want to apply the best parameters found during optimization to your model. The optimization settings (but not any existing optimization history or results) are also saved in the model.
Optimization Setup
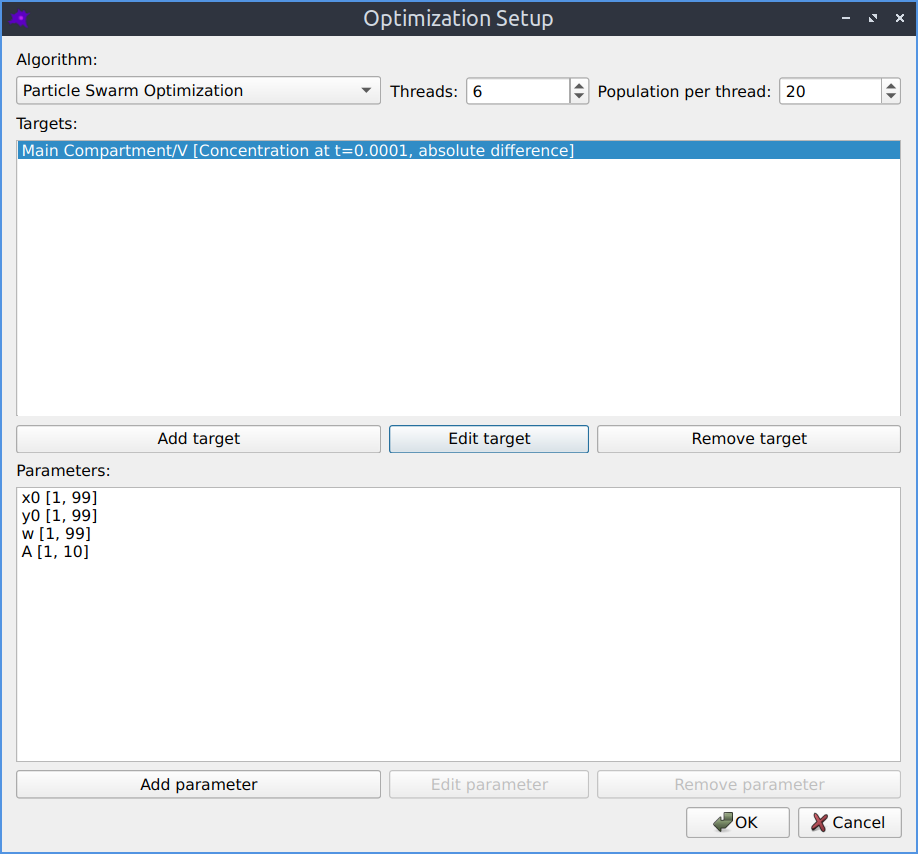
Parameter optimization setup.
- Algorithm
Choose which optimization algorithm to use
See the Pagmo algorithms documentation for more details about the available algorithms
- Threads
The number of populations to evolve in parallel
Typically this would be equal to the number of available CPU cores
- Population
The population size to evolve on each thread
Typically the more parameters are being optimized the larger this should be
- Targets
A list of target concentrations (or rate of change of concentrations) to optimize for
See the Optimization Target section for more details
- Parameters
A list of parameters to optimize
See the Optimization Parameter section for more details
Optimization Parameter
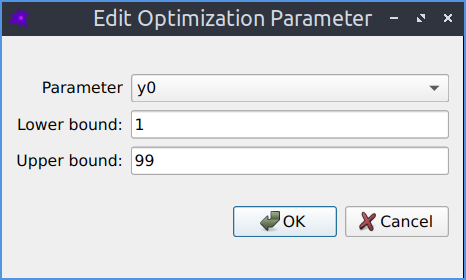
Adding or modifying a parameter to be optimized.
- Parameter
This can be a model parameter or a reaction parameter
- Lower bound
The minimum allowed value this parameter can take
- Upper bound
The maximum allowed value this parameter can take
Optimization Target
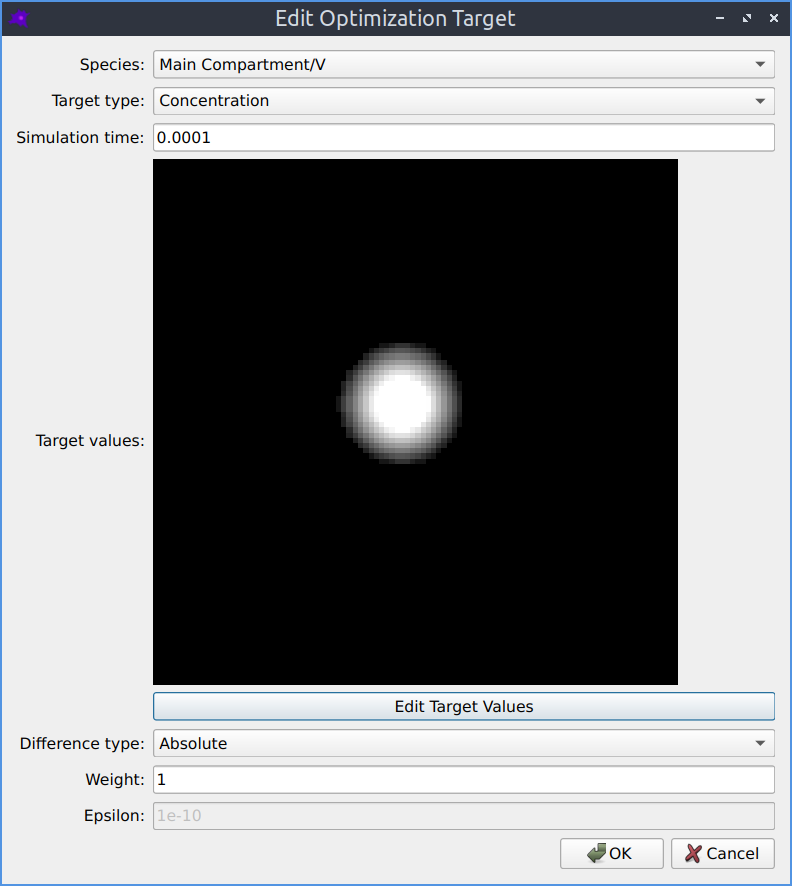
Adding or modifying a target to optimize for.
- Species
The species to target
- Target type
Either the concentration, or the concentration rate of change
- Simulation time
The timepoint in the simulation when this target should apply
- Target values
The desired spatial distribution of values
If not specifying this defaults to zero everywhere in the compartment
See the Optimization Target Image Import section for more details
- Difference type
How to compare the target \(t\) with the results \(r\)
Absolute: \(|r - t|\)
Relative: \(|r - t|/|t + \epsilon|\)
- Weight
The relative importance of this target
The cost function for this target is multiplied by this weight
Only relevant when there are multiple targets
- Epsilon
The \(\epsilon\) parameter in the relative difference measure
Avoids infinities caused by dividing by zero
Optimization Target Image Import
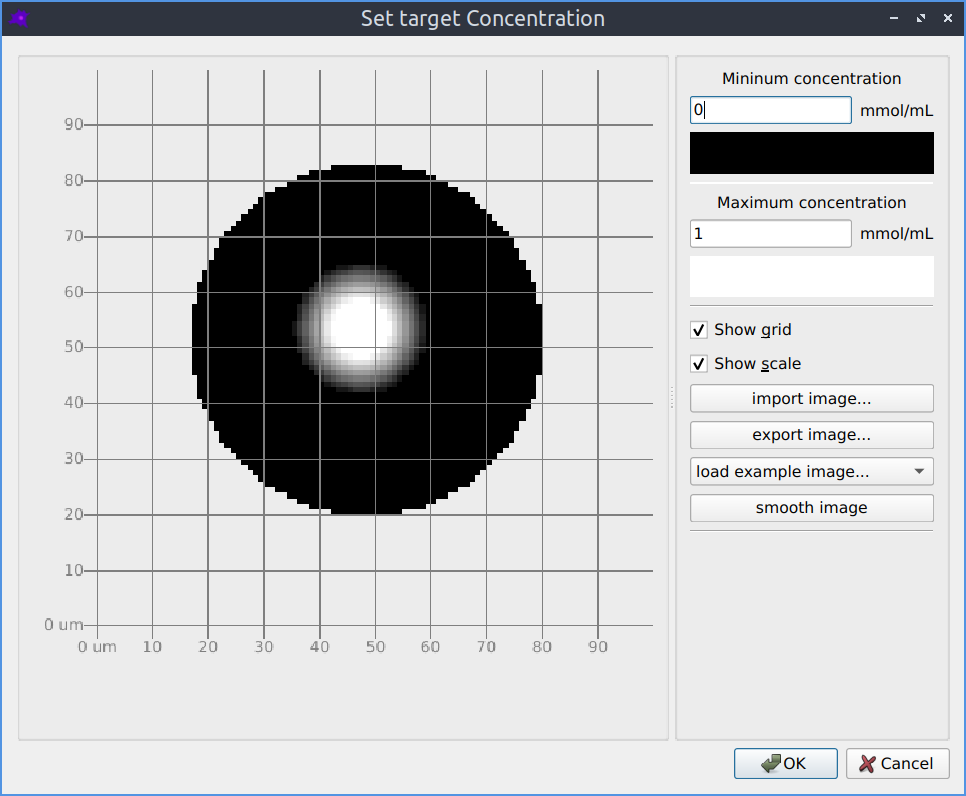
Importing a target species concentration from an image.
The spatial distribution of the target concentration or rate of change of concentration can be imported from a grayscale image in the same way as initial species concentrations.
- Minimum concentration
The concentration corresponding to a black pixel in the image
- Maximum concentration
The concentration corresponding to a white pixel in the image
More information
On each thread, a separate optimization is performed
Within each thread, each item in the population has a value for each parameter being optimized
It also has a fitness, which is the sum of the differences between each target and the corresponding result
With each optimization iteration, the parameters are evolved to improve (reduce) this fitness value
This means each iteration requires threads * population simulations of the model
The algorithms are all derivative free optimization methods